Blog
How the Candlefox Provider Dashboards Empower Campaign Performance Through Data
Another month, another Candlefox product.
This month, we’re proud to announce we’ve officially rolled out our new client-centric service – Provider Dashboards.
Introducing Provider Dashboards
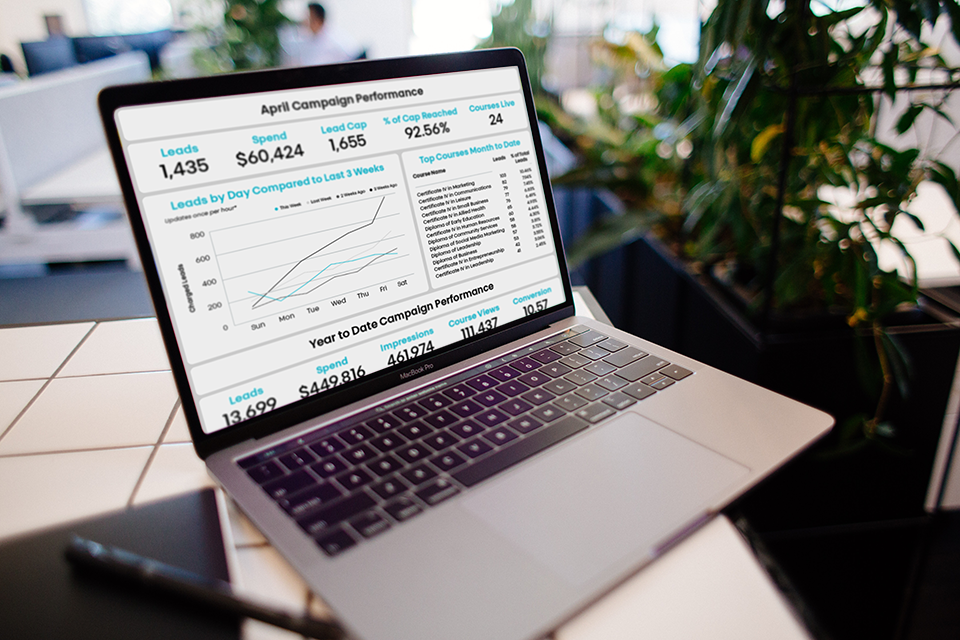
Our Provider Dashboards are a data visualisation tool that allows our providers to track, analyse and report on key campaign performance metrics.
Using our Dashboards, providers can monitor and evaluate the performance of our Marketplace lead generation service. They can then use this data to:
At Candlefox, we appreciate good data. That’s why we’ve made sure our Dashboard data is processed and updated in real time – enabling providers to pivot their marketing and sales strategies in the blink of an eye.

Why we created them
We created the Provider Dashboards to assist our providers in making informed, data-driven decisions about student recruitment.
We found an underlying need to improve the transparency and sharing of data with our providers. We needed a solution that met the specific data needs of our lead generation partners.
Our Dashboards:
Our Dashboards enable our in-house team and providers to efficiently track campaign metrics simultaneously. Using data visualisation, providers can easily unpack complex information and draw parallels between different metrics.
Empowering our partners is what makes Candlefox different. We equip our providers with the tools they need to deliver results and drive the most value to their business. That’s why we’ve created Provider Dashboards – with this new tool, providers can access their campaign data, anywhere and anytime.
Jim Rodd
Head of Partnerships
Candlefox
How our Dashboards work
Our Provider Dashboard tool provides a centralised, interactive means of monitoring, measuring and extracting relevant performance data.
We do this through a two-part service.
1. Dashboard interface
Our Dashboard interface is readily accessible – anywhere and anytime. Providers can obtain real time data regarding the effectiveness of their lead generation efforts.
Our Dashboards share monthly and top-level campaign performance, including metrics like:

In addition to this, our Dashboards provide yearly data on:
Providers can also use the embedded comparison tools to analyse how their current campaign is performing against prior periods (whether that’s weeks, months or years).
These evaluation tools are a valuable source for uncovering seasonality-related changes to student enrolment trends.
2. Weekly email report
Along with the Dashboard interface, providers receive a weekly report directly to their email inbox. Data from the Dashboard is compiled into an easy-to-read report, enabling providers to analyse their leads performance from a glance.
How we plan to improve
In its current form, our Provider Dashboards are one-size-fits-all. But this is only the beginning for us. We are always looking for opportunities to go above and beyond for our clients.
We value the relationship we have with the providers on our network and are constantly creating products and services that enable the growth and success of our clients. As we gather more feedback from our network, we’ll make optimisations to the Dashboards – think comparative tools, interactive widgets, and more Marketplace data.
Our Provider Dashboards are currently available to all partners in Australia and New Zealand – free of charge. We have plans to expand this service to the UK in the coming months.
We look forward to sharing more good news about Candlefox products and services in the future. Sign up for our newsletter to get updates delivered to your inbox.